| Module |
Name |
Version |
License |
Source |
Languages |
Platforms |
Type |
Author
|
| Vision |
Operation user interface (Qt)
|
9.5 |
GPL2 |
ui_Vision.so |
en,uk,ru,de,pt |
x86,x86_64,ARM
|
UI |
Roman Savochenko
Maxim Lysenko (2007-2012), Ksenia Yashina (2007-2008)
|
| Description
|
Visual operation user interface, based on the Qt library — front-end to the VCA engine.
- Total complexity: > 50 HD[!]
- Sponsored by, for finishing the mirroring of the primitive ElFigure on 0.3 HD[!]: SVItoVYR Ltd
|
The module provides to OpenSCADA a mechanism of the final visualization of the visualization and control area (VCA). The module is based on the multi-platform library Qt of the graphical user interface (GUI) of initially created by the firm TrollTech. In its work, the module uses the data of the VCA engine — module VCAEngine).
Visual control area (VCA) is an integral part of the SCADA system. It applies to the client stations with a view to providing accessible information about the control object and to for the the issuance of the control actions to the object. In various practical situations and conditions the VCA, based on different principles of visualization, may by applied. For example, this may be the library of widgets Qt, GTK+, WxWidgets or hypertext mechanisms based on the technologies HTML, XHTML, XML, CSS and JavaScript, or third-party applications of visualization, realized in various programming languages Java, Python, etc. Any of these principles has its advantages and disadvantages, the combination of which could become an insurmountable obstacle to the use of VCA in a practical case. For example, technologies like the Qt library can create highly-productive VCA, which will undoubtedly important for the operator station for control the technological processes (TP). However, the need for installation of that client software in some cases may make using of it impossible. On the other hand, Web-technology does not require installation on client systems and is extremely multi-platform (it is enough to create a link to the Web-server at any Web-browser) that is most important for various engineering and administrative stations, but the productivity and reliability of such interfaces is lower, that actually eliminates the using of them at the operator stations of TP.
OpenSCADA has extremely flexible architecture that allows you to create external interfaces, including user, in any manner and taste. For example, the OpenSCADA configuration environment available now as by means of the Qt-library, and also the Web-based.
At the same time, independent creation of the VCA implementations in different basis may cause the inability to use the configuration of one VCA in another one. That is inconvenient and limited from the user side, as well as costly in terms of implementation and follow-up support.
In order to avoid these problems, as well as to create as soon as possible the full spectrum of different types of VCA,
the project of conception of the Visual Control Area (VCA) is established. The result of this project — this direct visualization module (based on the library Qt), direct visualization module WebVision and the VCA engine VCAEngine.
1 Purpose
This module of the direct visualization of the VCA is designed for the formation and execution of VCA interfaces among the graphic library Qt. The VCA module mostly provides:
- three levels of difficulty in the formation of the visualization interface, which allow organically to develop and apply the tools by the principle — from simple to complex:
- formation from the template frames, by assigning the dynamics and without the graphical configuration;
- graphical formation of new frames, using ready-made visualization elements from the library - mnemosmes;
- forming, in the library, new ones: frames, template frames and display elements.
- construction of interfaces for visualization of practically any complexity (limited by the "discreteness" of the primitive functions), ranging from simple monitoring interfaces, and to complete hierarchical interfaces used in SCADA systems;
- providing the different ways of forming and configuration of the user interface, based on different interfaces of graphical representation (Qt, Web, ...), or-through the standard interface of OpenSCADA control;
- construction and correction of the interface, appointment and change of the dynamics in the process of the execution;
- construction, at the user level, of new template frames and the formation of specialized ones, under the scope, libraries of frames (e.g. the inclusion of parameters frames, diagrams and other elements linking them to each other), according to the idea of secondary use, accumulation and improvement;
- construction of new custom visualization elements and the formation of specialized, at the field of application, libraries of frames, according to the idea of secondary use, accumulation and improvement;
- description of the logic of new template frames and user visualization elements as by the simple links as well by the compact and full-featured user programming language;
- possibility of inclusion, to the user's visualization elements, the functions (or frames of functions' calculation) of the object model of OpenSCADA, practically linking the presentation with the algorithm of computation, for example, visualizing the library of the apparatus of TP models for subsequent visual building of the TP models;
- separation the data of the user interfaces and presentation interfaces of these data, allowing to build the user interface in the one environment, and execute in many others (Qt, Web, ...);
- ability to connect to the executable interface for monitoring and correction of actions; for example, training operators and monitoring their actions in real time;
- visual construction of various schemes with overlapping logical connections and subsequent centralized execution in the background - visual construction and execution of mathematical models, logic circuits, relay circuits and other;
- providing, to OpenSCADA, object API functions; can be used to control the properties of the visualization interface from user procedures;
- server construction for: frames, visualization elements and visualization interface projects; with the ability to service multiple client connections;
- simple organization of client stations on different bases (Qt, Web, ...) with the connection to the central server;
- full-featured mechanism for distributing authorities between users that allows you to create and execute projects with different rights to access their components;
- flexible formation of rules of alarms and notifications, with the support of various methods of the notification;
- support of custom formation of the palette and font preferences for the visualization interface, in styles;
- support of the user forming of the events maps under various control equipment and user's preferences;
- support for user profiles, allowing the identification of various properties of the visualization interface (colors, font features, the preferred card of events);
- flexible storage and distribution of libraries of widgets, frames and projects of the visualization interfaces in the databases, supported by OpenSCADA; practically, the user only has to register the received database with the data.
2 Tool of the graphical formation of the VCA interface
Development of the VCA interface is performed in a single window, realizing many documents interface (MDI) (Fig.2.a). This approach allows you to simultaneously open multiple frames of various sizes. The following mechanisms to control the development are used: toolbars, menus and context menus. Most actions are duplicated by different mechanisms, that allows you to quickly find the tool by the convenient method. Navigational interfaces are implemented by the attached windows. Configuration of the toolbars and attached windows is saved on exit and restored at startup that lets you to customize the interface for yourself.
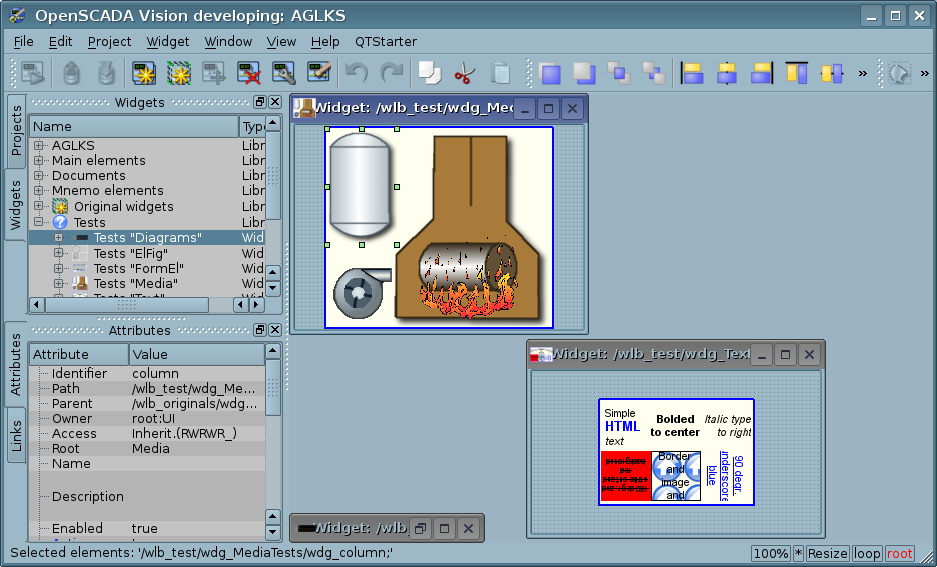
Fig.2.a. Window of development the VCA interface.
Access to major components of the VCA is made by attached windows, in the Figure 2.a these windows are shown on the left side. These windows contain:
- Tree of the widgets libraries. Using the navigator you can quickly find the needed widget or library and to do with them necessary operations. The following operations are implemented: add, delete, copy, call for settings of the widgets and libraries, cleaning and call for visual editing of the widget. For flexible control, the context menu is supported with the following items:
- "New library" — creation of the new library.
- "Add visual item" — adding of the visual element to the library-widget.
- "... from the Library" — submenu of adding of the visual element from other libraries to the library-widget.
- "Delete visual item" — deleting of the visual element from the library.
- "Clear visual item changes" — clearing of the visual element with the inheritance of modified properties or setting them by default.
- "Lower down visual item changes" — lowering down of the visual element changes to the parent, that will be used by other inheritances.
- "Properties of the visual item" — call for configuration of the visual element.
- "Edit visual item" — call visual editing of the element.
- "Copy visual item" — copy of the visual element, at the time of paste.
- "Cut visual item" — cut-move of the visual element, at the time of paste.
- "Paste visual item" — paste of the visual element.
- "Load from DB" — uploading data of the visual element from the database.
- "Save to DB" — saving data of the visual element to the database.
- "Manual on ..." — call manual on the selected library.
- "Refresh libraries" — rereading of the configuration and composition of the libraries from the data model.
- Tree of the projects pages. Provides the mechanism for "Drag and drop" for creation of the user frames based on the libraries elements. For flexible control, the context menu is supported with the following items:
- "Run project" — starting up of the chosen project execution.
- "New project" — creation of the new project.
- "Add visual item" — adding of the visual element to the project-page.
- "... from the Library" — submenu of adding of the visual element from other libraries to the project-page.
- "Delete visual item" — deleting of the visual element from the project-page.
- "Clear visual item changes" — clearing of the visual element with the inheritance of modified properties or setting them by default.
- "Lower down visual item changes" — lowering down of the visual element changes to the parent, that will be used by other inheritances.
- "Properties of the visual item" — call for configuration of the visual element.
- "Edit visual item" — call visual editing of the element.
- "Copy visual item" — copy of the visual element, at the time of paste.
- "Cut visual item" — cut-move of the visual element, at the time of paste.
- "Paste visual item" — paste of the visual element.
- "Load from DB" — uploading data of the visual element from the database.
- "Save to DB" — saving data of the visual element to the database.
- "Refresh projects" — rereading of the configuration and composition of the projects from the data model.
- Control panel of the widget attributes;
- Control panel of the widget links.
In the main space of the working window the pages of projects, frames of the widgets' libraries, user elements and elements of primitives at the time of their visual editing are placed.
At the top of the working window there is the menu. All the tools needed for development the VCA interfaces are placed in the menu. Menu has the following structure:
- "File" — General operations.
- "Load from DB" — uploading the data of the visual element from the database.
- "Load from DB forcibly" — uploading data of the visual element from the database forcibly, not only when it changed.
- "Save to DB" — saving data of visual element to the database.
- "Save to DB forcibly" — saving data of the visual element to the database forcibly, not only when it changed.
- "Close" — closing the editor's window
- "Quit" — quiting the program.
- "Edit" — Editing operations of the visual elements.
- "Undo visual item changes" — make visual item last changes undo.
- "Redo visual item changes" — make repeat for visual item changes.
- "Copy visual item" — copy of the visual element, at the time of paste.
- "Cut visual item" — cut-move of the visual element, at the time of paste.
- "Paste visual item" — paste of the visual element.
- "Project" — Operations over the projects.
- "Run project" — starting up of the chosen project execution.
- "New project" — creation of the new project.
- "Add visual item" — adding of the visual element to the project.
- "Delete visual item" — deleting of the visual element from the project.
- "Clear visual item changes" — clearing of the visual element with the inheritance of modified properties or setting them by default.
- "Lower down visual item changes" — lowering down of the visual element changes to the parent, that will be used by other inheritances.
- "Properties of the visual item" — call for configuration of the visual element.
- "Edit visual item" — call visual editing of the element.
- "Widget" — Operations over the widgets and the libraries of widgets.
- "New library" — creation of the new library.
- "Add visual item" — adding of the visual element to the library.
- "Delete visual item" — deleting of the visual element from the library.
- "Clear visual item changes" — clearing of the visual element with the inheritance of modified properties or setting them by default.
- "Lower down visual item changes" — lowering down of the visual element changes to the parent, that will be used by other inheritances.
- "Properties of the visual item" — call for configuration of the visual element.
- "Edit visual item" — call visual editing of the element.
- "View" — Management of the arrangement of visual elements on the frame.
- "Rise up" — rising the widget above.
- "Lower down" — lowering the widget below.
- "Raise up to the top" — rising the widget to the top.
- "Lower down to the bottom" — lowering the widget to the bottom.
- "Align to the left" — alignment of the widget to the left.
- "Align vertically to the center" — alignment of the widget vertically to the center.
- "Align to the right" — alignment of the widget to the right.
- "Align to the top" — alignment of the widget to the top.
- "Align horizontally to the center" — alignment of the widget horizontally to the center.
- "Align to the bottom" — alignment of the widget to the bottom.
- "Library: {Name of the library}" — menu items to access the frames-widgets in the library.
- "Window" — Management of the MDI windows.
- "Close" — closing the active window.
- "Close all" — closing all the windows.
- "Tile" — tiling all the windows for visibility at the same time.
- "Cascade" — cascading all the windows.
- "Next" — activating the next window.
- "Previous" — activating the previous window.
- "Widget: {Name of the widget}" — activation items of a particular window.
- "View" — Management of the visibility of the working window and the toolbars on it.
- "Full screen" — deploying the work window to the full screen.
- "Visual items toolbar" — control panel of the visual items.
- "Functions of the widgets visibility" — control panel of the location of the widgets on the frames.
- "Elementary figure tools" — Additional toolbar for the editing the primitive of the elementary figure ("ElFigure").
- "Projects" — attached window of control of the projects tree.
- "Widgets" — attached window of control of the widgets libraries tree.
- "Attributes" — attached window of the attributes manager.
- "Links" — attached window of the links manager.
- "Library: {Name of the library}" — control of the visibility of the toolbars of the widgets libraries.
- "Help" — Help for OpenSCADA and this module.
- "About" — information about this module.
- "About Qt" — Information about the Qt library, used by this module.
- "Manual on 'Vision'" — call manual on this module.
- "Manual on 'VCAEngine'" — call manual on the engine of the visualization and control area.
- "Manual on 'OpenSCADA 0.9.0'" — call manual on OpenSCADA in whole.
- "Manual on ..." — call manual on the selected library.
- "What's this" — query of the description of the elements of the window's interface.
- "QTStarter" — Menu item, created by the module for running the Qt library modules. Contains start buttons for UI modules OpenSCADA, based on the Qt library. This option allows you to open several instances of the windows of this module or other modules.
Above, under menu, or on the sides, there are the toolbars. Toolbars can be hidden or located, which is controlled in the menu item "View". The following toolbars are provided:
- "Visual items toolbar" — Control panel of the visual items:
- "Run the project execution for the selected item" — runs the project for execution and activates the selected page of the project.
- "Load the item data from DB" — uploading the chosen elements data from the database.
- "Save the item data to DB" — saving the chosen elements data to the database.
- "New project" — creation the new project.
- "New widgets library" — creation the new widgets library.
- "Add visual item" — adding of the visual element.
- "Delete visual item" — deleting of the visual element.
- "Properties of the visual item" — call for configuration of the visual element.
- "Edit visual item" — call visual editing of the element.
- "Undo visual item changes" — make visual item last changes undo.
- "Redo visual item changes" — make repeat for visual item changes.
- "Copy visual item" — copy of the visual element, at the time of paste.
- "Cut visual item" — cut-move of the visual element, at the time of paste.
- "Paste visual item" — paste of the visual element.
- "Functions of the widgets visibility" — Control panel of the location of the widgets on the frames:
- "Rise up" — rising the widget above.
- "Lower down" — lowering the widget below.
- "Raise up to the top" — rising the widget to the top.
- "Lower down to the bottom" — lowering the widget to the bottom.
- "Align to the left" — alignment of the widget to the left.
- "Align vertically to the center" — alignment of the widget vertically to the center.
- "Align to the right" — alignment of the widget to the right.
- "Align to the top" — alignment of the widget to the top.
- "Align horizontally to the center" — alignment of the widget horizontally to the center.
- "Align to the bottom" — alignment of the widget to the bottom.
- "Elementary figure tools" — Additional toolbar for the editing the primitive of the elementary figure ("ElFigure"):
- "Return the cursor" — returning to the cursor for the action over the figures on the widget.
- "Add line" — adding the line to the elementary figure.
- "Add arc" — adding the arc to the elementary figure.
- "Add besier curve" — adding the Bézier curve to the elementary figure.
- "Connections" — enabling of the of connections at the elementary figure.
- "Library: {Name of the library}" — The content of the panel depends on the contents of the library and includes the buttons for calling library items.
At the bottom of the development window of the VCA there is the status line. On the right side of the status line there are indicators of the visual scale of the edited frame, of the mode of changing of the size of the elements, of the mode of the VCA engine station and the user on whose behalf the development of the VCA interface is done. By double-clicking on the indicator of the user it can be changed the current user, entering the new username and password. In the main field of the status line it is displayed various information and assistance messages.
To edit properties of the visual elements there are two dialogues. The first dialogue allows you to edit the properties of containers of the visual elements, (Fig.2.b) — widgets libraries and projects. The second dialogue serves to edit the properties of the visual elements (Fig.2.d). Changes, made in the dialogues, at once, get to the VCA engine. To save these changes to the database, or restore from the database, it is necessary to use the appropriate tools of the main development window.
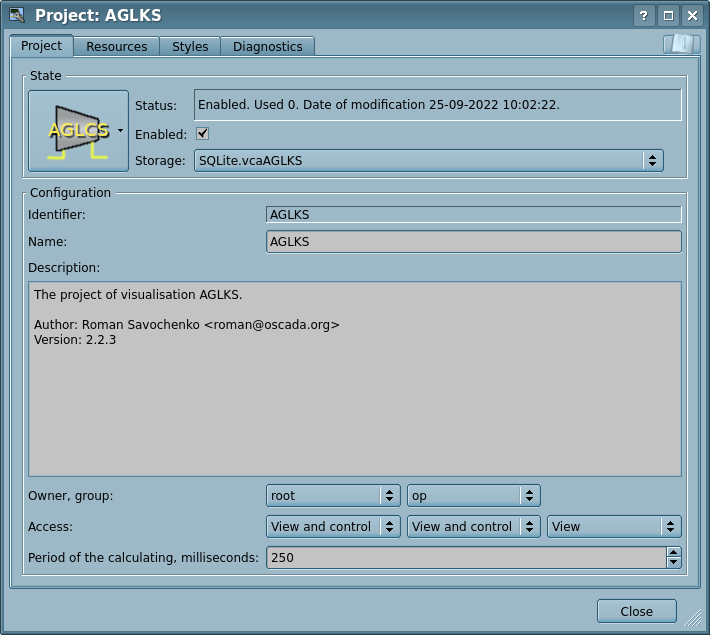
Fig.2.b. Dialogue of editing of the properties of the containers of the visual elements.
With the help of the main tab of that dialog you can obtain:
- State of the elements' container, that is: "Enabled", storage of the container (with tracking the availability of the data in different storages and providing the sequentially removing duplicates), usage counter, date and time of the last modification.
-
 The objects still support of specifying the spare storage addresses with tables before you rename the table in the standard form "wlb_{ObjID}" for the widget libraries and "prj_{ObjID}" for the projects.
- Identifier, name and description of the container.
- For the project:
- user, group of users and the access for: user, users' group and all other;
- period of the project calculating in the execution.
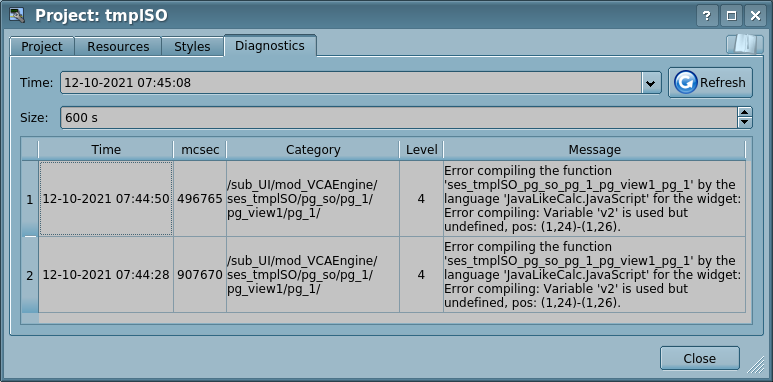
Fig.2.c. Tab "Diagnostics" of the project.
From this tab you can, for obtain the diagnostic messages: select the time, refresh to the current tiem and select the depth.
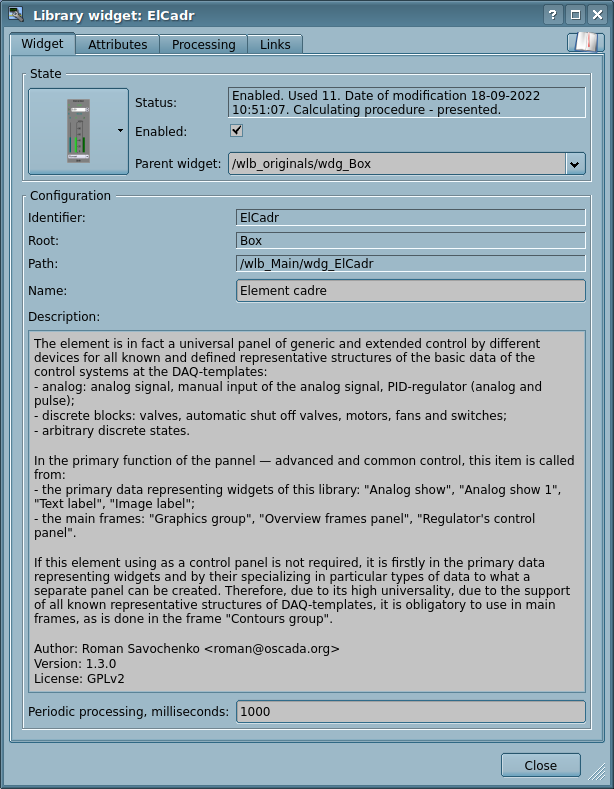
Fig.2.d. Dialogue of editing of the properties of the visual elements.
With the help of the main tab of that dialog you can obtain:
- State of the element; for information: "Enabled", counter of the use, date of the last modification, state of the calculation procedure; for control: icon, "Enabled", the page type (for pages), parent element.
- Identifier, root, path, name and description of the element.
- Periodic processing in milliseconds — for common control of the periodic processing of any element including ones who have not any calculation procedure, but that value can be used in the cascade for child elements. There reserved the special values:
- 0 — you want periodic processing with the session period;
- -1 — you want to use processing period of the parent widget/page/project in the cascade;
- -2 — for disable the periodic processing in whole.
Dialogue of editing the properties of the containers of the visual elements contains two tabs: configuration tab of the the main parameters (Fig.2.b) and configuration tab of the container resources (Fig.2.e).
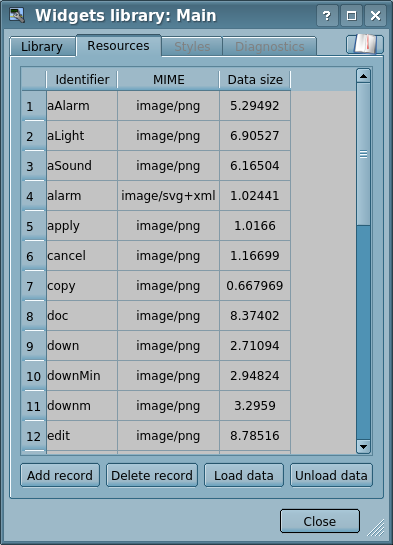
Fig.2.e. Editing tab of the container resources of the visual element.
Dialogue of editing the properties of the visual elements contains four tabs: configuration tab of the main parameters (Fig.2.b), tab of the element attributes (Fig.2.f), tab of the element processing (Fig.2.g) and tab of the element links (Fig.2.h). At different levels of the visual elements hierarchy some tabs can be available, but some are not. The attribute name's rows in the "Processing" tab after the first one treat as help.
Text attribute fields support the syntax highlighting, the rules are transmitted in the form of regular expressions from the control interface or can be builtin to the text value as a commentary in the XML-tag "SnthHgl".
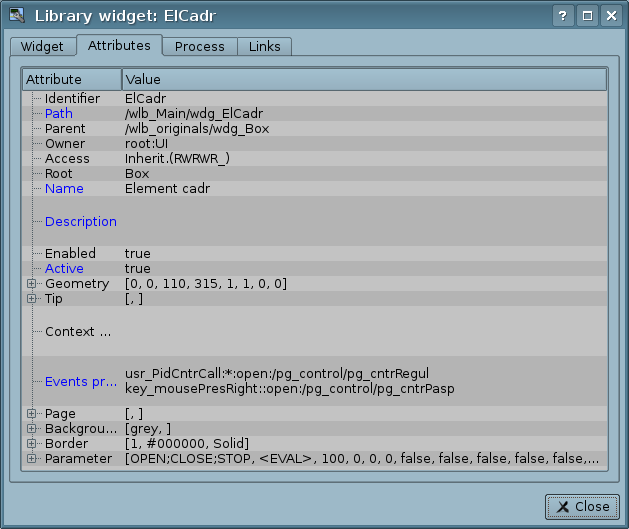
Fig.2.f. Attributes tab of the editing dialogue of the properties of the visual element.
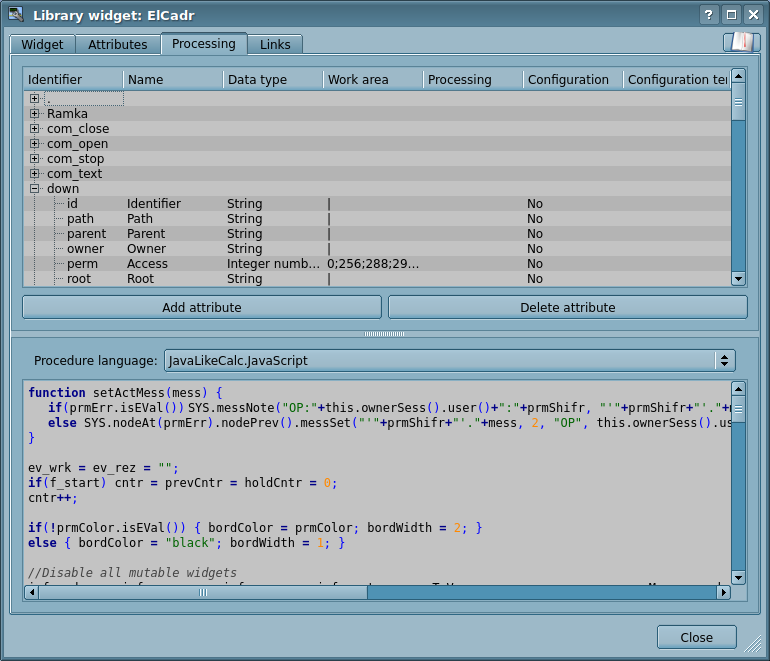
Fig.2.g. Processing tab of the editing dialogue of the properties of the visual element.
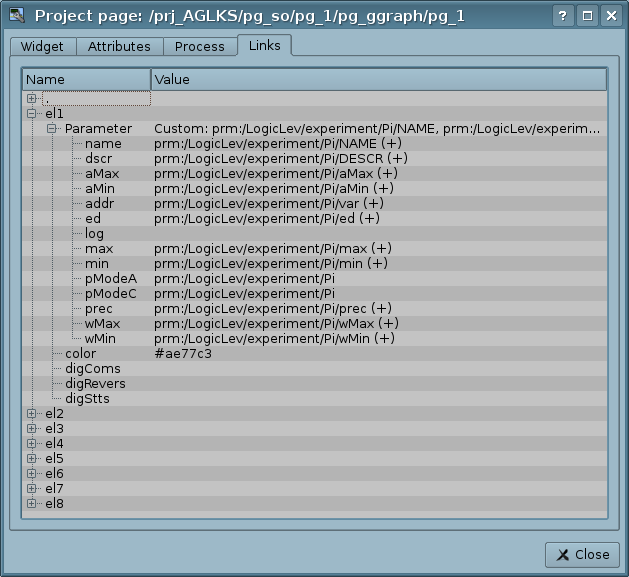
Fig.2.g. Links tab of the editing dialog of the properties of the visual element.
2.1 Styles
It knows that people can have individual features in the perception of graphical information. If these features are not taken into account, it is possible to obtain the rejection and abruption of the user to the interface of VC. This rejection and abruption can lead to fatal errors in the management of TP, as well as traumatize the human by the continuous work with the interface. In SCADA systems, arrangements have been made that regulate the requirements for creating the unified UI interface, which is normally perceived by most people. This is practically eliminates the features of people with some deviations.
In order to take this into account and allow centralized and easy to change the visual properties of the interface module is implementing a theme manager of the visualization interface.
User can create many themes, each of which will keep the color, font and other properties of the frame elements. Simple changing of the theme will allow you to change the interface of VC, and the possibility of appointing an individual theme in the user's profile allows to take into account his individual features.
To realize this opportunity, when creating a frame, it is necessary for the properties of color, font and others set the "Configuration" (of the table in the "Process" tab) in the value of "From style". And in the parameter "Configuration template" to specify the identifier of the style field. Next, this field will automatically appear in the style manager and can be modified there. The style manager is available on the project configuration page in the tab "Styles". In this tab, you can the styles create, delete and edit, delete their fields.
In general, the styles are available from the project level. At the level of the widget libraries you can only define the style fields for the widgets. At the project level, at the choice of style, it is started the work with styles, which includes access to the fields of styles instead of direct attribute values. In fact, this means that when reading or writing a widget attribute these operations will be carried out with the corresponding field of the chosen style. The configuration field "Write to style in the execution context" allows of dynamic changing the style fields in the execution context by writing to the proper attributes, but that can be done in wrong, so that is why the field is disabled by default.
When starting a project, the project-style will be used. The user can choose a style from the list of available styles of the running project. The user-selected style will be saved and used in next time the project is launched.
2.2 Linkage with the dynamics
To provide the visualization interface of relevant data, data from the subsystem "Data acquisition (DAQ)" should be used. The nature of these data is as follows:
- parameters that contain some number of attributes;
- attributes of the parameter can provide information of five types: Boolean, Integer, Real, String and Object;
- attributes of the parameter can have their archive (history);
- attributes of the parameter can be set to read, write and with full access.
Given the first point, it is necessary to provide the possibility of group-based reference. To do this, we use the logical level concept.
The links provide a transparent type conversion and do not require a special configuration.
To satisfy the opportunities for accessing to archives links make check of the attribute type, and in the case of connection to the "Address", the address of the link is put into the value.
In the VCA terms, the dynamic links and configuration of the dynamics are the one process, to describe a configuration of which the tab "Processing" of the widgets is provided (Fig.2.f). The tab contains a table of configuration of the attributes properties and the calculation procedure text of the widget.
In addition to configuration fields of the attributes the column "Processing" in the table provides, for selective using of the attributes in the computational procedure of the widget, and the columns "Configuration", "Configuration template", to describe the links configuration.
The column "Configuration" allows to specify the link type of the widget attribute:
- Constant — in the tab of widget links the field for indication of a constant appears, for example, of the special color or header of the template frames.
- Input link — linkage with the dynamics for read-only.
- Output link — linkage with the dynamics just for writing.
- Full link — complete linkage with dynamic, read/write.
- From style — take the value from the project's style.
The column "Configuration template" makes it possible to describe the groups of dynamic attributes. For example, it may be different types of parameters of the subsystem "DAQ" and other interface widgets. With the correct formation of this field, the mechanism of automatic assignment of attributes is worked, with only the parameter of the subsystem "DAQ" or the widget of the interface, which simplifies and accelerates the configuration process. Value of this column has the following format:
- For constant: direct the attribute value.
- For link: "{parameter}|{identifier}", where:
- parameter — group of the attribute;
- identifier — identifier of the attribute; same the value is compared with the attributes of the DAQ parameters with automatic linkage, after the group link indication.
- For style: identifier-name of the style field.
There may be several types of links, that are defined by the prefix:
- val: — Direct download value through the link mechanism. For example, the "val:100" link loads value 100 to the widget attribute. Often used in the absence of a terminal point of linking, for the purpose of directly setting the value.
- prm: — Link to the parameter attribute or parameter, in general, for the attributes group of the "Data acquisition" subsystem. For example, the link "prm:/LogicLev/experiment/Pi/var" performs the access of the widget attribute to the parameter attribute of the subsystem "Data acquisition". Sign "(+)" at the end of the address indicate about successful linking and presence of the target. For object-type attributes, there permissible hierarchical access to a specific property of the object, by specifying its path through the symbol '#', for example: "prm:/LogicLev/experiment/Pi/var#pr1/pr2".
- wdg: — Link to the attribute of another widget or widget, in general, for the attributes group. For example, the link "wdg:/ses_AGLKS/pg_so/pg_1/pg_ggraph/pg_1/a_bordColor" performs the access of the attribute of one widget to the attribute of another one. Supported both absolute and relative paths of the links. The reference point of the address of the absolute link is the root object of the module "VCAEngine", which means — the first element of the absolute address is ID of the session or project. The first element, on the side of the session, drops, so the links, installed in the project, work there. Relative links take a countdown from the widget where the link is specified. A special element of relative link is an element of a higher node "..".
- arh: — A special type of the link, available only for a separate attribute of the type "Address", which allows you to connect directly to the value archive ("arh:CPU_load"). It may be useful to specify the archive as a data source for the primitive "Diagram".
Processing of the links occurs at a period of the widget calculating in the following order:
- receiving the data from the input links;
- performing the calculation of the widget procedure;
- transmission the values by the output links.
Figure 2.g presents the tab with the possibility of group and individual assignment of attributes.
When placing a widget in the widget container, all links of the original widget are added to the list of resulting links of the widget container, however, only to a depth at one level of nesting.
From the foregoing it is clear that the links are set by the user during the configuration of the interface. However, in order to allow the creation of general-purpose frames with the function of providing detailed data of different sources of the same type, a dynamic linking mechanism is required. Such a mechanism is foreseen:
- reserving the key identifier "<page>" for the group of attributes of links in general purpose frames;
- dynamically assigning links to the identifier "<page>" in the process of opening a general-purpose frame by the signal from another widget.
Let's examine the example when we have the frame of general-purpose "Control panel of graph" and a lot of "Graphs" in different frames. "Control panel of graph" has links with the templates:
- tSek -> "<page>|tSek"
- tSize -> "<page>|tSize"
- trcPer -> "<page>|trcPer"
- valArch -> "<page>|valArch"
In this case, each widget "Graph" has attributes "tSek", "tSize", "trcPer" and "valArch". Calling the "Control panel of graph" by opening signal from any widget "Graph", the attributes of the "Control panel of graph" are linked together with the attributes of the "Graph" widget, according to the template. As a result, all changes in the "Control panel of graph" will be displayed on the graph, through these links.
If the "Graph" widget has external links to the parameters of the "Data acquisition" subsystem, the "Control panel of graph" links will be installed on the external source. Additionally, if the "Control panel of graph" will be declared the links to the missing attributes directly in the widget "Graph", then the search will be made for the presence of such attributes in the external source — the first one on which a direct link is established, performing, thereby, the addition of the missing links.
To visualize this mechanism the table is provided.
Table. The mechanism of the dynamic linkage.
| Attributes of the "Control panel of graph" (the template of dynamic linkage) |
"Graph" attributes |
Attributes of the external "Parameter" |
Resulting link or value of the linking attribute
|
| tSek (<page>|tSek) |
tSek |
- |
"Graph".tSek
|
| tSize (<page>|tSize) |
tSize |
- |
"Graph".tSize
|
| trcPer (<page>|trcPer) |
trcPer |
- |
"Graph".trcPer
|
| valArch (<page>|valArch) |
valArch |
- |
"Graph".valArch
|
| var (<page>|var) |
var |
var |
"Parameter".var
|
| ed (<page>|ed) |
- |
ed |
"Parameter".ed
|
| max (<page>|max) |
- |
- |
EVAL
|
| min (<page>|min) |
- |
- |
EVAL
|
2.3 Visual editing
Visual editing of opened frames in main space of the working window is performed mostly for the Box primitive or by inner specific editing for not container primitives like to ElFigure, entry to which performed at twice mouse click.
For any frames in the visual editor available only visually changing the geometry, what you can do by placing the mouse cursor to right and/or bottom edges of the frame and next move the edge whether by mouse, holding the left button, or by keyboard, pressing the arrow keys — the arrow keys clicking cause of the corresponding size changing at 5 pixels on 1x scale and holding the Shift key you get 1 pixel. You can also change the frame scaling in the same way but holding the key Ctrl or toggling of the size mode on the status panel right.
Visual editing of the Box primitive means of the children widgets APPENDING, REMOVING, MOVING, GEOMETRY CHANGING, SCALE CHANGING and PROPERTIES EDITING.
Only for the widgets APPENDING you need no other widgets selection on the frame, just select needed widget from the library on the toolbar, or drag and drop from the tree of the widgets libraries, and place that in a mouse position by clicking the left mouse button. To cancel the add operation from the library on the toolbar, click the right mouse button.
For other operations you need to select an available child widget or a group of them, so let's see all features of the selection:
- SINGLE SELECTION — performed by single click the left mouse button above child widget, next click puts down the selection to widget under the previous one and up to this frame itself, unselecting child widgets. That is the widget stack transition at the fact.
- SELECTION BY WINDOW — performs the group selection of the child widgets by drawing a window around those widgets, starting the window from the left mouse button press on any unselected frame space and finishing on the button release.
- ADDITIVE SELECTION — you can append some child widgets to the selection holding the Shift key and performing whether single selection or by window. In the case of the single selection, the widget stack transition is turned off here, and instead triggering of the top widgets selection is actually turned on!
The selection is saved at the keyboard focus loss when pressing the left mouse button on the selection for return.
For REMOVING the selected widget or group of them you can press whether the toolbar or context menu button "Delete visual item", or the Ctrl+D key shortcut.
As a combination of the APPENDING and REMOVING there for the selected widget or group of them you can copy/cut by the corresponding toolbar or context menu button or by the keyboard shortcut Ctrl+C/X and next unselect all and paste by the corresponding toolbar or context menu button or by the keyboard shortcut Ctrl+V.
For MOVING you can the selected widget or group of them drag, by pressing the left mouse button on the selected area, move the mouse to need position and drop, by releasing the mouse button; or can use for that the arrow keys — the arrow keys clicking cause of the corresponding position coordinate changing at 5 pixels on 1x scale and holding the Shift key you get 1 pixel.
For the GEOMETRY CHANGING of the selected widget or group of them you can point the mouse cursor to a green dot of the selection representation and next move the dot whether by mouse, holding the left button, or by keyboard, pressing the arrow keys — the arrow keys clicking cause of the corresponding size changing at 5 pixels on 1x scale and holding the Shift key you get 1 pixel. You can perform the SCALE CHANGING of the selection in the same way but holding the key Ctrl or toggling of the size mode on the status panel right. The coordinates of individual widgets in the selection change according to the ratio of their position in this selection!
The PROPERTIES EDITING of the selected widget or group of them is not a graphical operation mostly and performed in the control panel of the widget attributes, but the child widgets selection is very useful as allows you to select a group widgets for next them properties editing in general.
3 Execution of the VCA interfaces
Execution of the IU interface consists in launching a new project session or connecting to the current one, at the level of the VCA engine. Then the module of direct visualization represents and controls the session data. The main window of the execution mode of this module has the view presented at Figure 3.
Update of the contents of the open pages of the visual interface with periodicity of the project session is implemented. During the upgrade process:
- - request, in the model, of opened pages list and checking consistency of the really opened pages to this list;
- - requests of modified data on each opened page and its widgets;
- - updating content of the pages and their widgets in accordance with the received modified data.
When closing the "Runtime" window closes the project session in the data model if the session is not background and it was the last connection.
The mechanism of the request for only modified data is based on the absolute counter of the session execution. When you make real changes in the attributes of widgets the remembering of the value of this counter is made, which allows us to identify the modified attributes. This approach allows to increase productivity and reduce the load on the traffic in case of access to the model through the network.
Hierarchically, the module assumes the possibility of placing pages of the project as in the main window of execution (Fig. 3), and by placing inside the container widgets, as well as by opening additional windows over the main one.
When you expand the main execution window, or moving to the full-screen mode, scaling of the page content of the VCA interface is performed, filling the entire space of the window and allowing to execute the projects, developed on one screen resolution, at different resolutions.
The main window consists of menu (top) status line (bottom), and the executable contents of the session between them. Menu in the execution mode is positioned as the administrator tool of OpenSCADA, which contains system-wide functions, and is only available to privileged users in the "root" group. Menu has the following structure:
- "File" — General operations.
- "Print" — print:
- "Page" — page of the user interface;
- "Diagram" — diagram on the user interface;
- "Document" — document on the user interface.
- "Export" — export:
- "Page" — page of the user interface, to image;
- "Diagram" — diagram on the user interface, to image and CSV;
- "Document" — document on the user interface, to HTML and CSV for exporting tables;
- "Table" — table of the "Table" view of the primitive "FormEl" on the user interface, to CSV.
- "Close" — close the editor window.
- "Quit" — quit the program.
- "Alarm" — Alarm quietance:
- "Alarm level" — all alarms;
- "Light" — notification with the lighting;
- "Buzzer" — notification with the buzzing;
- "Sound/speech" — notification with the sound/speech.
- "View" — Display options of the project session.
- "Full screen" — switcher of the full screen execution mode.
- "Help" — Help through the VCA project, this module and OpenSCADA.
- "About" — information about this module.
- "About Qt" — Information about the Qt library, used by this module.
- "Manual on the project '{Name}'" — call the manual on the project of the visualization — a file with the name of the VCA project identifier.
- "Manual on 'Vision'" — call the manual on this module.
- "Manual on 'OpenSCADA 0.9.0'" — call the manual on OpenSCADA in whole.
- "QTStarter" — Menu item, created by the module for running the Qt library modules. Contains start buttons for UI modules OpenSCADA, based on the Qt library. This option allows you to open several instances of the windows of this module or other modules. In the case of the execution mode, this menu allows you to open the development window from the executing one, re-calling the module.
On the status line locates:
- On the right side:
- the clock, in the full-screen mode;
- the current VCA engine station;
- the current user, on whose behalf the VCA interface is executed — by a double-clicking this user can be changed, typing of the new username and password;
- the current interface style, which can be changed by a double-clicking.
- the panel with buttons:
- alarms quietance — by a click the violations can be quieted completely or just the desired type of the notification;
- export and print — calls by a click for the dialog of exporting and printing the default element or selected from the menu, where the export for:
- "Page" — page of the user interface, to image;
- "Diagram" — diagram on the user interface, to image and CSV;
- "Document" — document on the user interface, to HTML and CSV for exporting tables;
- "Table" — table of the "Table" view of the primitive "FormEl" on the user interface, to CSV and only for export.
- manual on the VCA-project — calls by a click the manual on the visualization project for the file "{ProjVCA_ID}.[pdf|html|odt]" in the document folder or specified in the "prjDoc" attribute.
- panel of user statuses and actions when specified in the "statLine" attribute; mouse clicking left, right and double forms events to the main interface page.
- In the main field of the status line various messages and assistance messages are displayed.
The Runtime mode mostly supports multi-language, which depends on the language of the selected user or the execution window, that is if you change the user you will get the Runtime interface at other language of the user. This function enabled for dynamic messages translation of OpenSCADA.
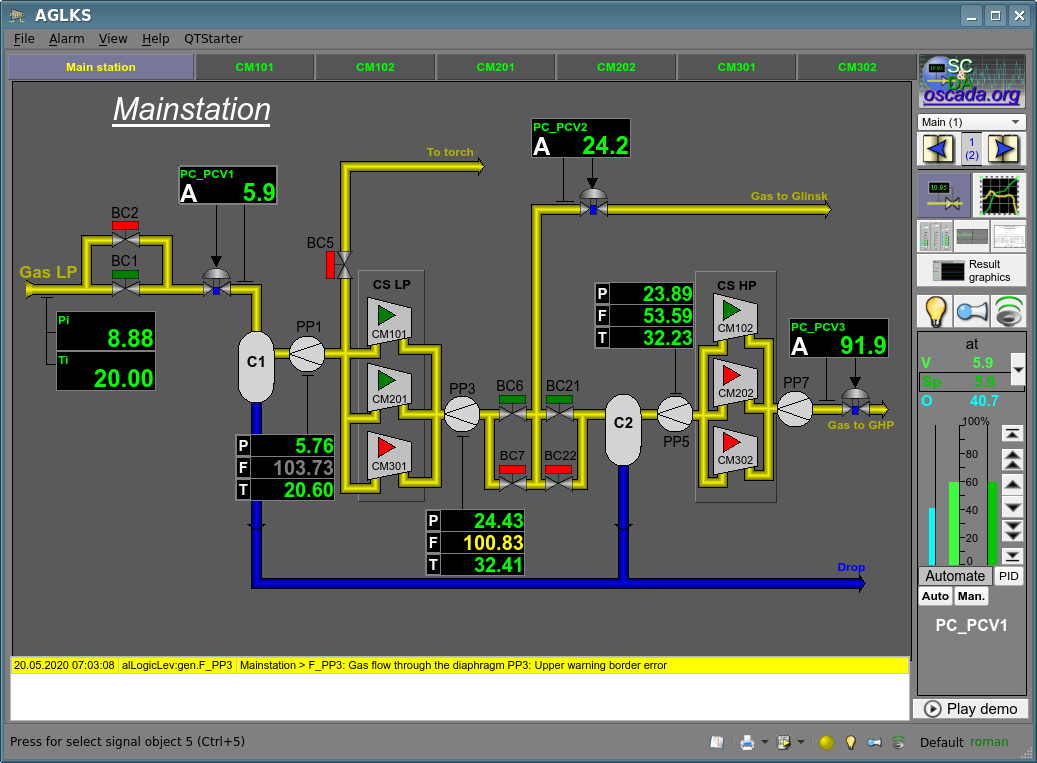
Fig.3. Main window in the execution mode.
4 Presentation of the basic elements (primitives)
This version of the module does not implement all the shapes of the primitives laid by the project. In general, the project provides the following primitives:
| Identifier |
Name |
Function
|
| ElFigure |
Elementary graphical figure |
The primitive is the basis for drawing elementary graphical shapes with their possible combinations in a single object. The support of the following elementary figures is provided:
- Line.
- Arc.
- Bézier curve.
- Fill of the enclosed space.
For all the figures, contained in the widget, set the common properties of thickness, color, etc., provides the possibility to specify the above-mentioned attributes for each figure separately and their dynamization.
|
| FormEl |
Element of the form |
Includes support for the standard form components:
- Line edit.
- Text edit.
- Check box.
- Button.
- Combo box.
- List.
- Tree.
- Table.
- Slider.
- Scroll bar.
|
| Text |
Text |
Text element-label. Characterized by the font type, color, orientation and alignment. Support for arguments is provided.
|
| Media |
Media |
Element of the visualization of raster and vector images of various formats, playback of the animated images, playback of the audio fragments and view of the video fragments.
|
| Diagram |
Diagram |
Element of the diagram with the support of the visualization in the real-time for the flow of several: trends (time charts), spectrum, XY diagrams.
|
| Protocol |
Protocol |
Element of the protocol — visualizer of the program messages, with support of the multiple operating modes.
|
| Document |
Document |
Element of the generating reports, journals and other documentation on the basis of available data.
|
| Box |
Container |
Contains the mechanism for other widgets placement-including with the purpose of creation of new, more complex, widgets and pages of the end visualization.
|
| Function, in plane |
Function of API of the object model of OpenSCADA |
Not visual widget, on the runtime side, which allows to include a computing function of the object model of OpenSCADA in the VCA.
|
For all implemented primitives, except "FormEl," this module supports the conditional generation of events from the mouse manipulator at the transparency of the pointed pixel, more than zero — not complete transparency.
The visualizer module provides and uses set of specific attributes of the generic means, the information of which is given in the table. These attributes are automatically created by the visualizer in their absence and during the first run, or created by the user in the frame of the specified area, as needed.
| Identifier (area) |
Name |
Appointment
|
| runWin (main page) |
Window of the execution |
Setting the mode of the main window execution:
- "Original size (0)".
- "Maximize (1)".
- "Full screen (2)".
|
| keepAspectRatio (main page) |
Keep aspect ratio on scale |
Keep aspect ratio of the pages on scale.
|
| stBarNoShow (main page) |
Do not show the status bar |
Hide the status bar of the main window.
|
| winPosCntrSave (main page) |
Control and save for position of the windows |
Enabling the windows position control and save.
|
| notify{N}, notifyVisVision{N} (page) |
Notification: type {N} |
Create manually with the type "Text"!
Specifies a notifier and a procedure of the notification resource obtaining and the same notification, accordingly to the "Signalling (Alarms)" conception. The notification performed in such priority — notifyVisVision{N} > {Qt|Phonon} > notify{N}. That is the notifyVisVision{N} is most priority, it overrides the {Qt|Phonon} notification and there you can implement very not ordinary notifications.
|
| statLine (main page) |
Status line items |
Create manually with the type "Text"!
Text field with description of the status line item in the string form "{Id}:{Label}:{ToolTip}:{Color}:{Img}", where:
- "Id" — identifier, uses also to form events from the widget "stIt_{Id}".
- "Label" — visual label of the status element.
- "ToolTip" — context help about the element.
- "Color" — label color.
- "Img" — image of the status element, instead the label.
|
| userSetVis (main page) |
Setting the user |
Create manually with the type "String"!
Change the user or call a dialog to select it. Variants of the value:
- "*" — call for a selecting dialog of the user;
- "$" — change the user to the default one;
- "{user}[:{password}]" — direct change to user with password; for empty password, the user is changed only if its permission is lesser or equal and that is the local visualisation; a useful example of changing to the "user" after one minute inactivity:
if((SYS.time()-this.ownerSess().userActTm()) < 60)userSetVis = "";
else if(this.ownerSess().reqUser() != "user") userSetVis = "user:user";
|
| prjDoc (main page) |
Project document |
Create manually with the type "String"!
Specifying the project documentation of call from the status line's button with a possibility of disabling-concealing the button at empty value. The documentation specified in view "{OffLine}|{OnLineOpenSCADAWiki}", for example for the AGLCS project — "AGLCS|Using/Model_AGLKS".
|
| vs_background (the views "Line edit", "Text edit", "Combo box", "List", "Tree", "Table" of the primitive "FormEl") |
Custom background |
Create manually with the type "String"!
Specifies for the custom background in the form {color}-{transp} {image}.
|
| vs_border (the views "Line edit", "Text edit", "Combo box", "List", "Tree", "Table" of the primitive "FormEl") |
Custom border |
Create manually with the type "String"!
Specifies for the custom border in the standard CSS-form {wdth}px {style} {color}.
|
| vs_winTitle (the view "Box") |
Window title |
Create manually with the type "String"!
Dynamic window title value.
|
Consider the implementation of each primitive in more detail.
4.1 Elementary figure primitive (ElFigure)
Support of the following elementary figures is provided: line, elliptical arc, Bézier curve and fill of the closed circuit with the color and image. For the elementary figures the following operations are provided:
- creation/deleting of the figures;
- copying of the figure(s);
- moving and resizing of the figures by the mouse manipulator and keyboard;
- possibility to connect the elementary figures to each other, getting more complex figures, for which all the properties of the source elementary figures are available;
- possibility of simultaneous movement of several figures;
- fill of the closed circuit with the color and image;
- generation of mouse key events at the time of the click on the filled spaces;
- scaling;
- transformation: rotation and mirroring.
Figure shows a part of the screen with a frame containing the elementary figures.
About the inner graphical editor on the module Vision in details you can read in the corresponding section "Vector graphics editor" and here we describe only useful tips.
The figures underlying this widget, containing the points (the start and end ones) that can be connected with the according points of other figures; and the points with the help of which the geometry of the figure can be changed.
It is possible to add the figure using the mouse manipulator:
- Select the desired figure from the context menu.
- Set, with the left mouse-button, start and end points (for line, with the SHIFT key hold its orthogonal drawing is made).
The deleting of the figure(s) it is possible by pressing "Del", having selected figure(s).
The copying of the figure(s) it is possible by pressing keys "Ctrl"+"C", having selected figure(s).
Moving/resizing of the figure it is possible by using the mouse manipulator or keyboard:
- Select the figure, by clicking on it with the left mouse button.
- Drag (with the help of mouse or control keys) the figure or one of its control points in the desired location and release the mouse button (key).
It is possible to move several selected figures, selected by holding "Ctrl" (works when the "Connections" button is unlocked) or by mouse.
The connection of the figures with each other it is possible by the following way:
- Press the button "Connections".
- Select one of the figures and move its start or end point to the desired start or end point of the other figure so that it will get to the appeared circle. Connected figures are moving as well as the individual — the general point is moved for all connected figures, to which it refers, where the priority is given to the arc and two arcs can't be connected directly with each other.
To fill the closed contour from the figures it is possible with the following way:
- Press the button "Connections".
- Create the closed contour.
- Make the double-click of the mouse inside of it.
To delete the fill of the closed contour it is possible:
- from the context menu, right-clicking of the mouse manipulator over the fill;
- breaking the closed contour;
- double-clicking of the mouse manipulator on the filled space.
Rotation of the figure is made around the widget center and mirroring is made around the central vertical axis-line.
4.2 Text primitive (Text)
Support of the text element with the following properties is implemented:
- Font with the properties: type-class, size, bold, italic, strikeout and underline.
- Text color.
- Text orientation.
- Automatic word wrap.
- Alignment of the text horizontally and vertically with all variants.
- Displaying the background as the color and image.
- Displaying the border around the text, with the specified color, width and style.
- Displaying HTML.
- Addition of the text by arguments of different type and properties.
Figure represents a part of the screen with the frame containing the text examples using various parameters.
4.3 Primitive of the form element (FormEl)
Provides support for the form elements on the VCA frames with the planed properties, including the types:
- Line edit — Represented by the following types: "Text", "Combo", "Integer", "Real", "Time", "Date", "Date and time". All kinds of line editor support the confirmation of entry.
- Text edit — Provides the flat-text editor with the confirmation or denial of entry.
- Check box — Provides a field of binary flag.
- Button — Provides the button with support of the button color, image in the button and the modes:
- standard;
- checkable;
- call the menu;
- call the file loading;
- call the file saving.
- Combo box — Provides a field for selecting an item from the list of specified items
- List — Provides the list box with the control of the current item.
- Tree — Provides the tree element with possibility of an item selection.
- Table — Provides the table element with the possibility of selecting for cells, rows or columns and editing the cell content.
- Slider — Slider element.
- Scroll bar — Scroll bar.
- Password — Hidden password typing.
The "Enabled" and "Active" modes are implemented, as well as the transfer of changes and events to the data model of the VCA — engine. The mode "Active" cause to the activity cursor set for not empty background and the addition conditions of the different views "Text", "Media" and "Box":
- Text — not empty text;
- Media — not empty source image.
Figure represents a part of the screen with the frame containing the above-listed elements of the form.
4.4 Primitive of the displaying the media-materials (Media)
Support of the element of the displaying of the media-materials with the following properties is provided:
- Indication of the media data source: images or video-material.
- Review of the images of most well-known formats with the possibility of fitting in the widget size and keeping aspect ratio here.
- Playback of the simple animated images and video formats with the possibility to control the playback speed.
- Playback of the full-formatted video and audio by Qt or Phonon.
- Displaying the background as the color and image.
- Displaying the border along the perimeter of the widget, with the specified color, width and style.
- Formation of the active areas and generating the events when they are activated.
Figure represents a part of the screen with the frame containing examples of reviewing/playback of the media-data.
4.5 Primitive of constructing diagrams (Diagram)
The diagrams construction element releases for types: "Graph", "Spectrum" and "XY", with properties:
- General properties of the diagram types "Graph", "Spectrum" and "XY":
- possibility to select the archiver, the archive buffer or all their, at working with the archiving data;
- adaptation of the parameter graph to real data values by adjusting the scale, in the absence of a directly specified range of values;
- controlling by axis ranges in way increasing, decreasing and shifting;
- wide range of scaling and adapting the time axis with automatic fitting the requested data to quality pretty for imaging, or needed for export — specifying the maximum number of measurements per pixel;
- imaging dimensional grid and markers in horizontal and vertical with adapting to the imaging range;
- tracing mode of the current time by periodically updating and shifting the time of the diagram to the current time — the time of the last data in the archive buffer;
- horizontal sliding by mouse;
- scaling of a window selected part, by the mouse.
- Properties of the diagram type "Graph":
- constructing graphics up to 100 parameters per diagram in a percentage scale and displaying the selected parameters in its own scale;
- constructing graph for: current, archiving and users data;
- forming of an intermediate display buffer for current values;
- support for the active mode with cursor and getting values under the cursor;
- possibility of construction graphics as into both linear and logarithmic scale of the values.
- Properties of the diagram type "Spectrum":
- construction of graphics of the frequency spectrum of parameters up to 100 on one diagram in a percentage scale and the ability to display selected parameters in its own scale;
- constructing graph for: archiving and users data;
- support for the active mode with cursor and getting values under the cursor;
- Properties of the diagram type "XY":
- construction of XY graphs of parameters up to 50 on one diagram in a percentage scale and the ability to display selected parameters on its own scale;
- constructing graph for: current, archiving and users data;
- forming of an intermediate display buffer for current values;
- the parameters distributed by pairs at one graph, where paired by axis Y (0,2,4...) and unpaired by axis X (1,3,5...);
- possibility of construction graphics as into both linear and logarithmic scale of the values.
The visualizer module provides and uses set of specific attributes of this primitive, the information is shown in the next table.
| Identifier |
Name |
Appointment
|
| sclWin |
Zooming the area framed by a window, mouse. |
A logical attribute type that is created by the user manually, as needed. For true, activates the mode of zooming the trend area framed by the window with the mouse.
|
Figure represents a part of the screen with the frame containing examples of the diagrams: "Graph", "Spectrum" and "XY".
4.6 Primitive of the protocol formation (Protocol)
Provides for support of the element of the protocol formation with the following properties:
- Protocol formation from the message archive for the specified time and depth.
- Request of the data from the message archivers.
- Selection of the data from the archives by the level of importance and the template of the message category.
- Support the mode of the tracking for the messages appearance in the message archive.
Figure represents a part of the screen with the frame containing an example of the protocol.
4.7 Primitive of the report formation (Document)
Provides for support element of the report formation with the following properties:
- Flexible formation of document structure based on HyperText Markup Language, which provides support for a wide range of features in the documents formatting.
- Formation of the documents at a command or a schedule, which necessary for creation of reports to the archive and then reviewing the archive.
- Formation of the documents in real time, to provide them completely dynamically and on the basis of archives at the specified time.
- Using the widget attributes for transmission to the document of values and addresses to the archives, which allows you to use the document widget as a template when generating reports with other input data.
The basis of any document is the XHTML template. The XHTML-template is the tag "body" of the WEB-page which contains the document's static in the standard XHTML 1.0 and elements of the executable instructions in the user programming language of OpenSCADA in the view <?dp {procedure} ?>. The resulting document is formed by the procedures execution and insertion of their result into the document.
The source for values of the executable instructions are the widget attributes of the primitive, as well as all the mechanisms of the user programming language OpenSCADA. Attributes may be added by the user and they can be linked to the actual attributes or parameters or they can be autonomous, values of which will be formed in the widget procedure. In the case of linked attributes the values can be extracted from the archive-history.
Figure represents the frame, containing a sample of the document.
4.8 Primitive of the box-container (Box)
Provides for support of the container primitive, which, in combination, plays the role of project pages. This primitive is the only container-element, which can itself include links to frames from the library, thus forming the user elements of the desired configuration. The primitive implements the properties provided by the project. Let's list, in points, the properties of this primitive:
- Container — Allows forming the desired objects by grouping in the primitive borders.
- Page — Elements, constructed on the basis of the primitive, may serve as a page of the user interface.
- Container of pages — Property of substitution, in the execution process, of its own content by another page. Used to create frames on the pages of the user interface. For example, the main page of the typical SCADA-system with signal objects is constructed in this way.
- Background — Supports for ability to specify the background as color and image.
- Border — Supports for displaying of the border with the specified color, width and style.
An example of editing a frame based on this primitive is shown in Figure 2.a, and Figure 3 shows a page that contains a page container built on this primitive.
5 Vector graphics editor
5.1 Purpose
The presence of own vector graphics editor is an integral part of self-respecting SCADA system. Experience shows that the most informative form of the technological process presentation is a mnemonic schemes — a set of signal devices, images of the equipment and internal connections of the controlled object, running on a PC. To create them, you can use any of the existing graphical editors. However, thus obtained the mnemonic schemes are static and do not reflect the dynamics of changes in the characteristics of the process and, consequently, they are inadequate and uncomfortable for perception. Thus, one of the tasks facing the developers of SCADA systems is the creation of a graphical editor for creation (painting) the objects, whose characteristics can be dynamically changed.
5.2 Principles and functions of the graphic editor
The basis of the described editor are three graphic primitives: line, arc, Bézier curve. The dynamically changing characteristics of these primitives include:
- Coordinates of the control points used to define the shape of the line, arc or Bézier curve. The line has 2 control points, the arc — 5, Bézier curve — 4 (Fig.5.2.a).
- Line width.
- Border width.
- Border color.
- Line style.
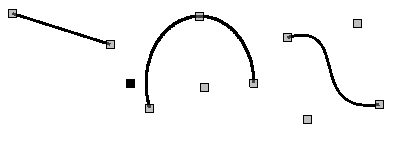
Fig.5.2.a. Control points of the line, arcs and Bézier curve.
Examples of the primitives, of different colors, widths, styles, with borders or without ones, are shown in Figure 5.2.b.
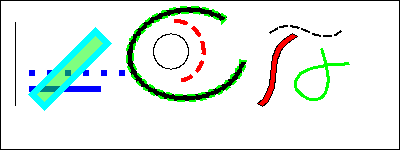
Fig.5.2.b. Examples of the primitives, from left to right: line, arc and Bézier curve.
It is possible to connect various graphic primitives, to create complex graphic objects. If the connected primitives make the closed contour, it can be filled with color and image (Fig.5.2.c).
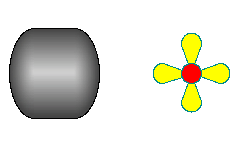
Fig.5.2.c. Fills of the closed contour with the color and image.
The graphics editor allows you to zoom and rotate the figures (Fig.5.2.d) — primitives and complex graphic objects.
The features of the editor also include: selection, moving, copying and deleting the figures.
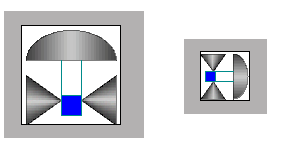
Fig.5.2.d. Zooming and rotating the figures.
5.3 Basic principles of operation in the graphical editor
In order to get started with the graphical editor, after launching the OpenSCADA project, you need to call "Operation user interface (Qt)". The "Widgets" tab contains a list of existing graphical libraries and items that belong to them.
Suppose we need to add a graphic element to one of the existing libraries. To do this, select the library name, and click the button ( ) on the toolbar. In the appeared window enter the Identifier and name of the new graphic element. After that, let's move on to this element and press the button (
 ). The drawing area will appear on the right. Using the double-click mouse over this field, or by using the context menu, we will enter the editing mode — the graphic editor mode, which allows you to perform all the provided manipulations with the figures. At that moment, when the graphic element we created is in focus, the tab "Attributes" will look like it is shown in Figure 5.3.a.
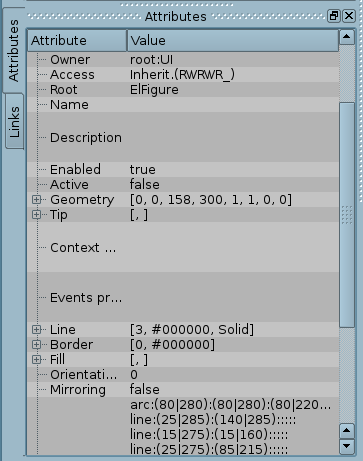
Fig.5.3.a. Attributes of the elementary figure.
With the help of mouse, or the "Geometry" field of the "Attributes" tab, let's define the drawing area size and scale coefficients.
Using the "Line" field of the "Attributes" tab, lets define the width, color, line style of the figures, which we'll draw. With the "Border" field let's define the width and color of the border. The "Fill" field allows you to specify color, and image for the fills. "Elements list" contains a list of primitives used to create the graphical object. Elements of all fields of the "Attributes" tab can be dynamically changed in the user procedure.
Graphical primitives can be drawn with the mouse or by specifying the list of graphical primitives ("Elements list"). In the first case, the coordinates of the control points of the primitive are computed automatically, and width, color, style of the line, width and color of the border are set by defaults, from the "Attributes" tab. In the second case, the primitive must be described in the "Elements list" as follows:
- line:(x1|y1):(x2|y2):width:color:border_width:border_color:style (1)
- arc:(x1|y1):(x2|y2):(x3|y3):(x4|y4):(x5|y5):width:color:border_width:border_color:style (2)
- bezier:(x1|y1):(x2|y2):(x3|y3):(x4|y4):width:color:border_width:border_color:style, (3)
Where:
- (x1|y1) — coordinates of the first control point of the primitive;
- (x2|y2) — coordinates of the second control point of the primitive;
- (x3|y3) — coordinates of the third control point of the primitive;
- (x4|y4) — coordinates of the fourth control point of the primitive;
- (x5|y5) — coordinates of the fifth control point of the primitive;
- width — line width, with which the primitive will be drawn;
- color — line color, with which the primitive will be drawn;
- border_width — border width;
- border_color — border color;
- style — line style ("0" — solid, "1" — dashed, "2" — dotted).
In this case, the values of the width, color, style of the line, width, and color of the border in the elements list are priority. If you want to use any of the properties, that are set in the fields "Line" or "Border" of the "Attributes" tab, then during the description of the primitive they should be skipped. For example, we want to create a line with: width 3, red color, solid and without border. At the same time in the "Line" field the following properties are set: line width 3, black color and solid style; and in the "Border" field: border width 5, green color. Then the description of the primitive in the elements list will be as follows:
- line:(x1|y1):(x2|y2)::red:0:: (4)
Expressions (1) - (4) define the static properties of the primitives that can not be changed in user's procedure. To specify the dynamic properties it is necessary to use the following expression:
- line:1:2:w1:c1:w2:c2:s1 (5)
Then, the "Attributes" tab will be appended by the fields: Point 1 (1), Point 2 (2), Width 1(w1), Width 2(w2), Color 1(c1), Color 2(c2), Style 1 (s1) (Fig. 5.3.b). Values of these fields can be changed in user's procedure, using the user programming language of OpenSCADA. Obviously, if desired, not all properties of the primitive can be declared dynamic, but one or more, in addition, one dynamic property can be used repeatedly.
Editing the coordinates of the control points is made using the mouse or by changing them in the elements list, for static points; or directly in the "Attributes" tab, with dynamic points in place ("Point 1", ...). Editing the other properties is made by means of changing the content of the fields "Line", "Border", "Fill" of the "Attributes" tab or the elements list.
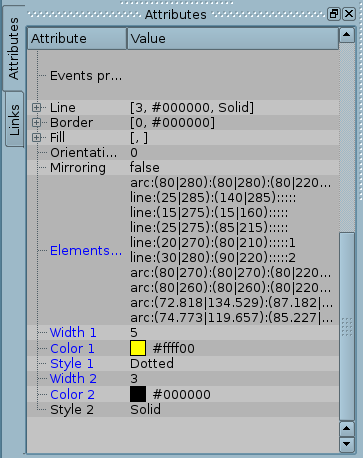
Fig.5.3.b. Dynamic attributes of the elementary figure.
There are possibilities:
- selection:
- left mouse click on the figure;
- joint selection of the primitives — left mouse button + the "Ctrl" key pressed, having disabled the "Connections" button;
- joint selection by the frame, drawn by holding down the left mouse button.
- moving, by keyboard/mouse;
- copying and pasting — "Ctrl" + "C", "Ctrl" + "V" or from the popup menu;
- deleting — "Del".
To connect primitives with each other you need:
- Press the button "Connections".
- Select one of the figures and move its start or end point to the desired start or end point of the other figure so that it will get to the appeared circle.
To fill the closed contour it is necessary to make double click of the left mouse button inside it or to specify the fill in the elements list as follows:
- fill:(x1:y1):(x2:y2):...:(xn:yn):color:image — static;
- fill:1:2:3:...:c1:i1 — dynamic.
Where:
- (x1:y1):(x2:y2):...:(xn:yn) — coordinates of the start and end points of the primitives that form a closed contour;
- color — fill color;
- image — fill image.
The priority values are the color and image of the fill, set in the elements list. If you want to use the characteristics set by the "Fill" field of the "Attributes" tab, then, when describing the primitives, they should be omitted.
To scale the figures it is necessary, in the "Geometry" field, to set the scale for the "X" and "Y" axes. In addition, there is the ability to visually zoom in/out the widget without changing the scale in the "Geometry" field. You must exit the editing mode, right click on the widget field, select in the popup menu "Zoom in (+10%)"/"Zoom out (-10%)" or rotate the mouse wheel while holding the "Ctrl" key pressed. Exit the editing mode is made either by pressing the "Esc" or using the popup menu of the widget.
There is a possibility to rotate the content of the widget, for which it is necessary in the "Attributes" window to set "Orientation angle" from -360 to 360.
The graphical editor supports color transparency, defined as follows: {color}-{t}, where color — the color, and t — transparency from 0 (fully transparent) to 255 (opaque).
The popup menu by the right-clicking in the editable widget is provided. Depending on what an object is under the mouse, popup menu can take several different forms. Below, in Figure 5.4, there are examples of the popup menu.
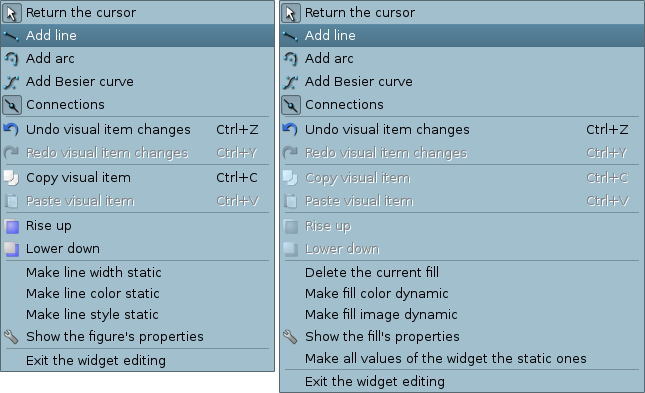
Fig.5.4. Popup menu for the lines (line, arc, Bézier curve) and for the fill, from left to right.
The popup menu includes the following sections (from the top to the bottom):
- drawing:
- selecting the figure to paint;
- selecting the mode "Connections";
- returning to the selection mode — "Cursor".
- undo/redo the changes;
- copy and paste the selected figures, within one widget;
- rising and lowering the selected figures along the "Z" axis;
- control for the primitives' attributes: to make static or dynamic;
- calling the properties dialog of the elementary figure;
- exiting the editing mode.
5.5 Properties dialog of the elementary figure
Dialog, versions of which are shown in Figures 5.5.a, 5.5.b, 5.5.c, is implemented for interactive and comfortable user control of the properties of the figure(s).
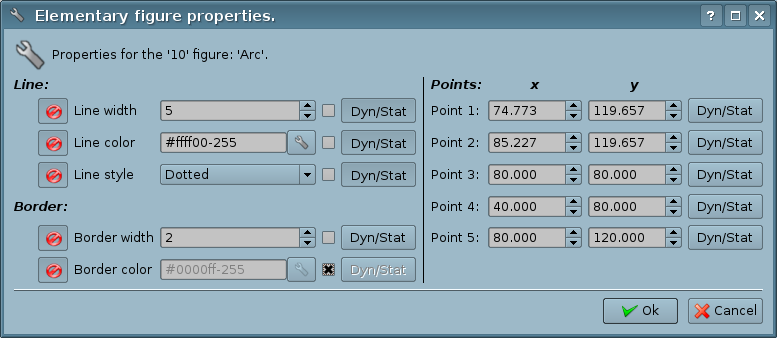
Fig.5.5.a. Properties dialog of the elementary figure for single figure (line, arc or a Bézier curve).
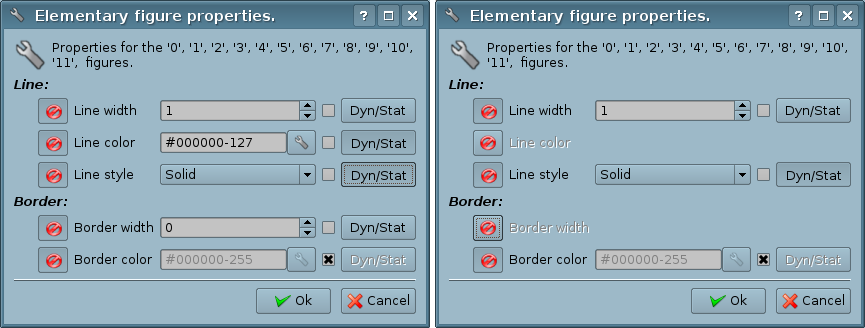
Fig.5.5.b. Properties dialog of the elementary figure for the group of selected figures.
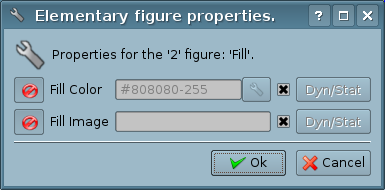
Fig.5.5.c. Properties dialog of the elementary figure for the fill.
As can be seen from the figures above, the dialog can be of three different forms, depending on the object for which it is called. In the title of the dialog there are the numbers of figures, for which it is called. These numbers correspond to the figures positions in the elements list, starting from the top.
If the dialog called for a single figure (line, arc or a Bézier curve), then it is possible to edit the points' coordinates of the figure (Fig.5.5.a). If the point is connected to the point of another figure or figures, and "Connections" are enabled, then entered coordinates will be applied to all connected figures and fills, which involved the figure, will be redrawn accordingly.
If the dialog is called for the group of selected figures (Fig.5.5.b), properties (attributes) listed in the dialog will be applied to all figures listed in the title of the dialog. When you call the dialog, in the fields of the properties will be shown the data of the figure from the group of selected ones, for which it was called the popup menu. There is the possibility to include/exclude certain properties of the dialog. For this the ( ) button is provided. In the case of exclusion of individual properties, they will not be processed upon acceptation of the dialog ("Ok" button). After the acceptation of the dialog, all of the data of the enabled properties will be applied to the whole group of figures.
Dialog for the fill's properties (Fig.5.5.c) allows you to manage the properties of the specific fill.
When selecting a check box to the right of a property, it (the property) after the acceptation of the dialog is set to the default value, which is listed in the "Attributes" tab. The "Dyn/Stat" buttons make the appropriate properties dynamic or static.
6 General module configuration
To set up own behavior in non-obvious situations, the module provides the ability to configure individual parameters through the control interface of OpenSCADA (Fig.6).
- Module state: "Running", number of individual displays in the library of Qt and main widows list.
- Exit when closing the last running project — useful for solutions that are immediately launched on the project interface.
- Reset widget styles to common — required for some widget styles like "gtk" in some specific widgets in run mode, like buttons for the background color and images.
- Lifetime and maximum number of the cached pages. The visualiser provides acceleration of the user interface placing previously opened pages into the cache, to control the storage time and maximum number of the pages in which this properties are intended. Indication of the zero value in general excludes cleaning the cache.
- The link to the configuration page of the external OpenSCADA stations and the station of the VCA-engine of the remote OpenSCADA, where reserved the special items:
- "<Local>" — the current local station;
- "<Select>" — use for querying the station together user and password at the module generic call, useful at presence of many control stations and for opening several of them simultaneously.
- Starting user — points on behalf of what user to open the module window without requiring the password, for local station. For remote station it is points to an user different from the typical one, pointed into the host configuration.
- User password (remote station) — password of the user different from the typical one, pointed into the host configuration.
- Connection recovery time, in seconds (remote station) — indicates the time that the lost remote connection is restored.
- List of the projects for launch, separated by symbol ';', for their automatic execution with the launch of the module. To provide the possibility to indicate the opening of the window of the project execution on the desired display of many display systems, the recording format of the project "PrjName-1" is provided, where 1 — the number of the target display. To connect to the background or another open session use "ses_ {SesID}".
- The display selection function is possible for non-virtual and non-duplicate desktops, that is, when using xinerma or NVidia in the appropriate mode. Technically, the Qt-function screen() should return various display widget objects by their numbers.
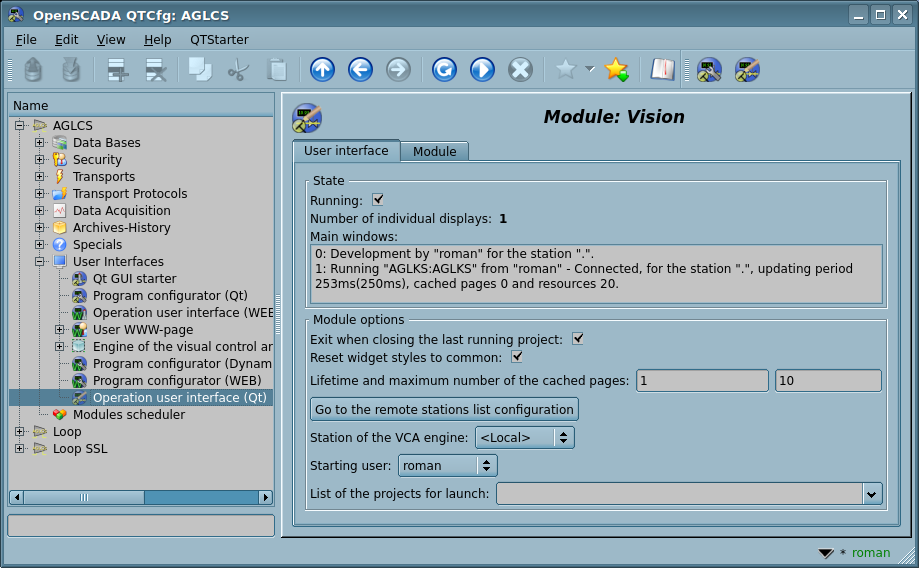
Fig.6. Configuration page of the module.


